
15 JUL 2026
Website check-up: the 7 metrics that matter
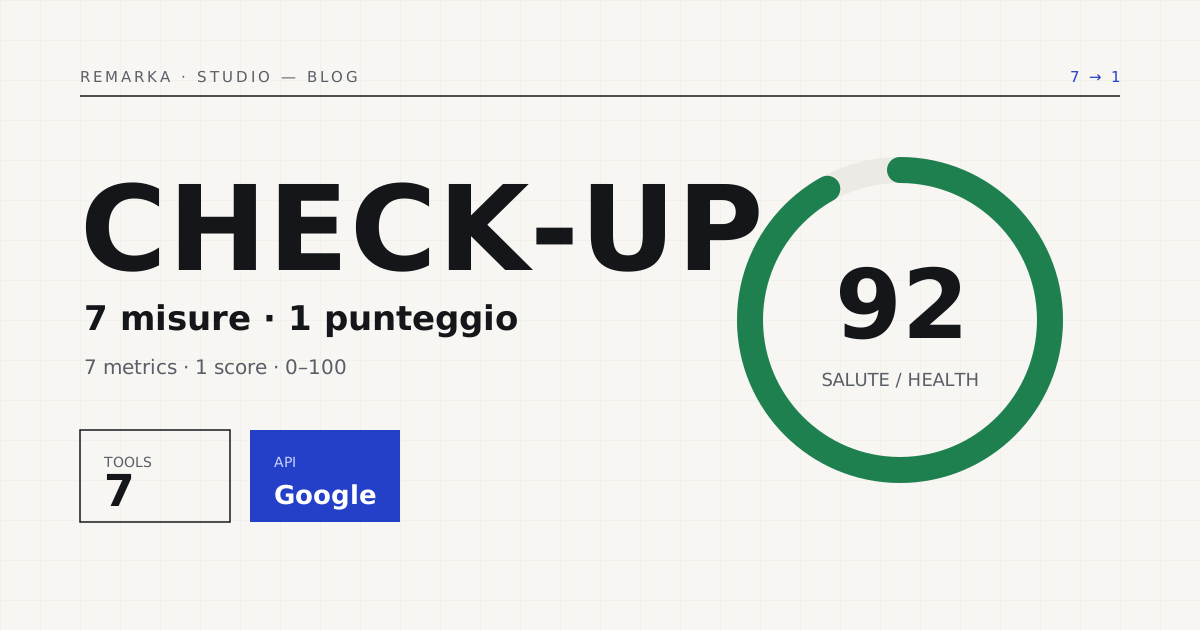
“Do you think our site is in good shape?” It’s the question half our calls start with, and the serious answer isn’t “yes” or “no”: it’s “depends what you measure.” A beautiful site can be painfully slow; a lightning-fast one can be invisible to Google; one that’s perfect for Google can turn away one person in ten over an accessibility problem. Running a website check-up means looking at it on several fronts at once, with numbers, not by eye. Here are the seven metrics that really matter, and how to read them without becoming a technician.
Why a single number isn’t enough (and seven are).
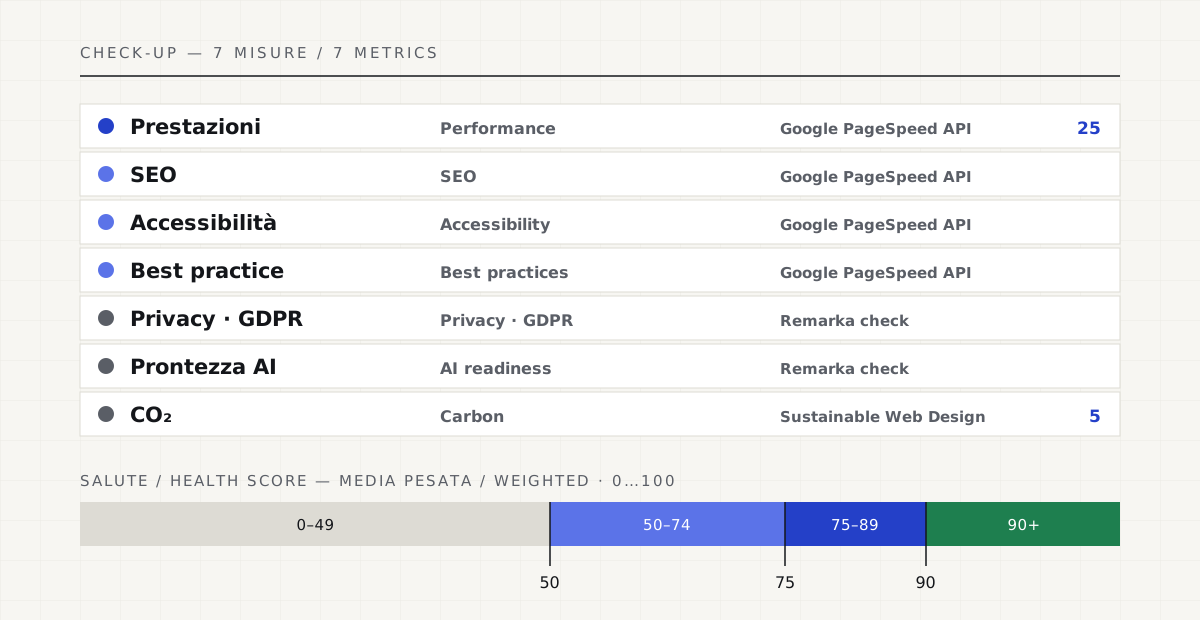
A single score reassures, but it misleads. “PageSpeed 92” says something about speed and nothing about privacy, accessibility or AI readiness. That’s why a serious check-up doesn’t look at one thing: it lines up seven dimensions and weights them, so you see at a glance where the site is solid and where it loses points — and which problems are worth fixing first.
The four metrics that come from Google.
Four of the seven metrics aren’t our opinion: they come from the Google PageSpeed API, the same one that powers pagespeed.web.dev, queried in mobile mode because that’s the version Google ranks you by.
Web Vitals, Google’s definition →
The three metrics we add ourselves.
The other three we calculate directly, reading the site as a visitor would. Privacy compliance we read from the HTML (banner, notices, trackers firing before consent); AI readiness from four signals — llms.txt, AI-crawler access, structured data, sitemap; the CO₂ footprint from the page’s real weight, using the Sustainable Web Design model. These are indicative checks, and we say so: the privacy check isn’t legal advice, and the score doesn’t promise a position on Google. It’s a precise technical snapshot, not a sales promise.
How to read the health score.
The health score is the weighted average of the seven metrics, and it reads like a traffic light: 90 and up you’re in the green band, 75 to 89 is good, 50 to 74 there’s real room to improve, below 50 is critical and becomes the priority. Two caveats: a high score doesn’t mean “first on Google” — it means sound technical foundations; and if a metric comes back “N/A,” it’s usually not a fault on your side, but a saturated server or an automated read that was refused.
The best part is that you can measure all this yourself, free and in under a minute, by pasting in the site’s address. The full report, page by page, comes as a PDF; and if the check-up shows the technical foundation is worth rebuilding, the redesign starts there — from the numbers, not from a hunch.
Run the full check-up, free and with no sign-up →
If the foundation needs rebuilding: redesign and migration →
Sources.
The figures and claims in this article come from here. These are primary sources, not summaries: open them and check for yourself.
- web.dev — Web VitalsThe definition of the speed and experience metrics that weigh most in the check-up.
- Google — helpful, reliable content (E-E-A-T)The official guide to what Google considers quality: it’s the backdrop to the SEO dimension.
- WCAG 2 — W3C/WAI overviewThe standard behind the accessibility measure, now also a legal requirement in the EU.
- Sustainable Web Design — emissions estimateThe model we use to calculate the CO₂ footprint from the real page weight.
- Chrome UX Report (CrUX)Google’s field data on real users, the basis of the speed metrics.
Let’s talk about your website.
Free analysis of your current website; a fixed quote within 24 hours of the call.