
Free tool /12
Website comparison: your site vs a competitor.
Two addresses, one verdict. We put your site and a competitor’s through the same seven measures — speed, SEO, accessibility, GDPR, best practices, AI readiness and CO₂ impact — with real Google data. See at a glance who wins and where to catch up. No sign-up.
How it works
Two sites, seven measures, one winner.
01
Paste the two addresses
Your site in field A, a competitor’s in field B. The home page or your highest-traffic page works best, for both.
02
We measure both with Google
We run the same checks on both sites — PageSpeed Insights for performance, Lighthouse for SEO, accessibility and best practices, plus our own checks for GDPR, AI readiness and page weight.
03
Read who wins and where
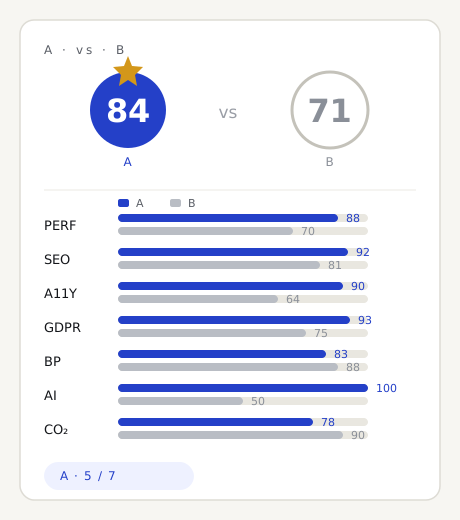
Two overall scores side by side, seven dimensions with the advantage row by row, and the summary “A wins, 5 of 7”. No jargon, no sign-up.
The method
What this tool actually compares.
The comparison isn’t an opinion: both sites go through the same measurement engines, at the same moments, with the same criteria. Performance comes from Google’s PageSpeed Insights API in mobile strategy — the version Google uses to rank. Technical SEO, accessibility and best practices come from Lighthouse. GDPR, AI readiness and CO₂ impact come from our own public checks, the same ones behind the Lab’s dedicated tools. Every dimension is normalised from 0 to 100, so the two overall scores are directly comparable.
It’s fair to say what the comparison does not do. It measures one page per site, not the whole domain; it does not count inbound links, brand authority or revenue; and it is not legal advice on GDPR. It is the technical snapshot of two pages across the same seven measures, not the market ranking of two companies. An advantage here is a real, verifiable technical advantage — an excellent starting point, not the last word.
Reading the result
How to read the comparison between the two sites.
At the top are the two overall scores: the star marks who wins overall. Below, each row is a dimension with two bars — yours in ultramarine (A), the competitor’s in grey (B) — and the numeric value beside it. The final summary counts the dimensions where site A leads: “A · 5 / 7” means you win five measures out of the seven actually recorded. Look at the rows where you lose: those are the priorities to catch up on, often the cheapest to fix.
Two honest caveats. If a measure comes back N/A for a site, that row is left out of the count: it happens when a page blocks crawlers or doesn’t respond in time — try again a few minutes later. And remember that scores swing by a few points between runs: what matters are the clear gaps between the two sites, not a two-point margin. A technical tie on a dimension isn’t a defeat: it’s a good sign for both.
Three common questions
Can I compare any site, even a competitor’s?
Yes: we only measure public pages, with the same tools anyone can use on pagespeed.web.dev. No access to the site or permission is needed: this is data observable from the outside.
Why is a dimension sometimes N/A?
When a page blocks crawlers, responds too slowly, or Google’s API times out, that measure stays N/A for that site and is left out of the win count. Try again after a few minutes: the second measurement often succeeds.
Does winning the comparison mean I’ll rank higher on Google?
Not directly: the comparison measures the technical quality of a page, not domain authority or content. But a better technical base helps ranking and conversion — it’s the ground everything else works better on.
Want to beat the competitor on every row?
A free report with the full comparison, priorities ranked by impact, and a fixed quote to close the gap where it counts.
The other free tools