
23 JUL 2026
INP, the new Core Web Vitals metric: what it measures and how to fix it

Since March 2024 there’s one more acronym to keep an eye on: INP. It has taken the place of another metric, FID, among Google’s Core Web Vitals — the three parameters the engine uses to measure the real experience of people browsing. The change isn’t cosmetic: many sites that passed the test with FID now find themselves struggling with INP, because the new metric is stricter and catches problems that used to stay invisible. Let’s look at what INP actually measures, why your site can seem fast and still fail it, and the concrete steps to get back into good values.
What INP is and why it replaced FID.
INP stands for Interaction to Next Paint. In plain terms, it measures responsiveness: when you tap a button, open a menu or type in a field, how long it takes before the screen responds by showing the result. It’s one of the three Core Web Vitals metrics, alongside LCP (loading speed) and CLS (visual stability).
Until March 2024, responsiveness was measured with FID, which however only looked at the delay of the very first interaction — and, worse, only the initial wait, not the full response. INP is more honest: it looks at every interaction during the visit and takes the slowest one, from the start of the tap to when the page actually shows the change. That’s why many sites “passed” by FID now find themselves slow under INP: the new metric measures what the user actually feels.
What it really measures, and Google’s thresholds.
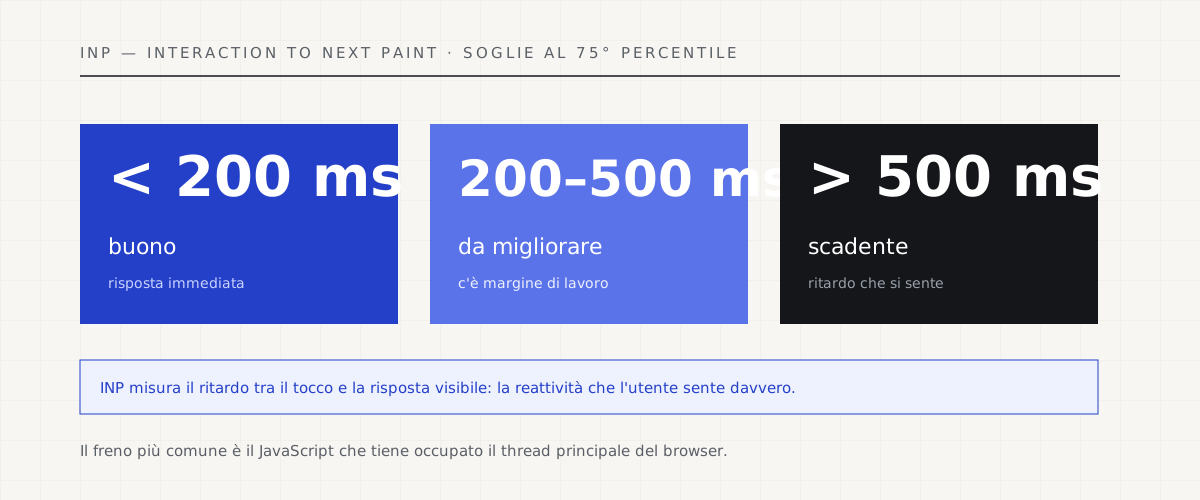
The thresholds are clear. An INP under 200 milliseconds is considered good: the page responds in a way the user perceives as instant. Between 200 and 500 milliseconds there’s room for improvement; above 500 milliseconds the experience is poor and noticeable — that annoying micro-delay between the click and the reaction. Google evaluates the 75th percentile: it’s not enough to be fast “on average”, it has to be fast for the vast majority of real interactions.
And here’s the point: real. Google judges Core Web Vitals on “field” data, collected from real Chrome users (the Chrome UX Report), not on one-off lab tests run from your brand-new computer on a great connection. That’s why an honest test looks at field numbers: it’s the experience of your visitors with their phones and their networks, not the ideal one.
Measure your site’s real Core Web Vitals for free →
Why a site can “seem” fast and still fail INP.
A site can load in a flash and then freeze up at the very first tap. The culprit is almost always the same: too much JavaScript keeping the browser’s “main thread” busy — the same thread that also has to respond to your clicks. If a piece of code runs for a long time without a break, the interaction sits queued up waiting — and that wait is exactly what INP measures. Loading finished a while ago, but the page “isn’t responding”.
The typical causes are well known: heavy third-party scripts (chat widgets, banners, trackers, widgets), themes and plugins that load huge libraries even where they aren’t needed, event handlers that do too much work on every click. These are things that classic speed tests, all focused on loading, never surfaced. INP brings them out into the open: it measures the moment the user tries to use the site, not just the moment they watch it appear.
How to fix INP.
There’s one strategy: lighten and break up the browser’s workload. Cut unnecessary JavaScript and defer loading what isn’t needed right away; split long operations into short chunks, so the browser can respond to taps in between them; keep third-party scripts in check, since they often weigh more than the site itself. These are technical interventions, but everyone feels the effect: the page reacts instantly.
The right method is to measure before and after, always on real data. You start by identifying the slowest interactions on smartphones (where processors are weaker and problems show up more clearly), fix the code that slows them down, and verify that INP at the 75th percentile drops below the good threshold. It isn’t magic: it’s removing weight until the page responds the way it should.
Responsiveness is an investment, not a detail.
INP isn’t just another acronym to keep Google happy: it measures a very concrete frustration, that half-second where the site “does nothing” after you’ve tapped it. On mobile, where most visits happen these days, it’s the difference between a site that feels like an app and one that feels broken. And since it counts toward Core Web Vitals, it also affects rankings: responsiveness and visibility travel together.
In our projects, responsiveness isn’t a last-minute patch: it comes from technical choices — less unnecessary code and third-party scripts kept in check — from day one. A site that loads fast but responds slowly is a promise kept only halfway — and INP, finally, puts that in black and white.
Technical SEO that starts from real speed →
Read also: Core Web Vitals in 2026, what Google measures →
Read also: images and speed, WebP and lazy-load →
Sources.
The figures and claims in this article come from here. These are primary sources, not summaries: open them and check for yourself.
- web.dev — Interaction to Next Paint (INP)The official definition of the metric and its thresholds, explaining the shift from FID to INP in 2024.
- web.dev — optimizing INPThe practical guide to improving responsiveness: reducing and splitting main-thread work, managing event handlers.
- web.dev — Core Web Vitals (Google)The three metrics (LCP, INP, CLS), their thresholds and why they matter: the real experience, not lab numbers.
- Chrome UX Report (CrUX) — documentationThe source of “field” data: real Chrome users, on whom Google evaluates Core Web Vitals at the 75th percentile.
Let’s talk about your website.
Free analysis of your current website; a fixed quote within 24 hours of the call.