
12 JAN 2026
Core Web Vitals in 2026: what Google actually measures
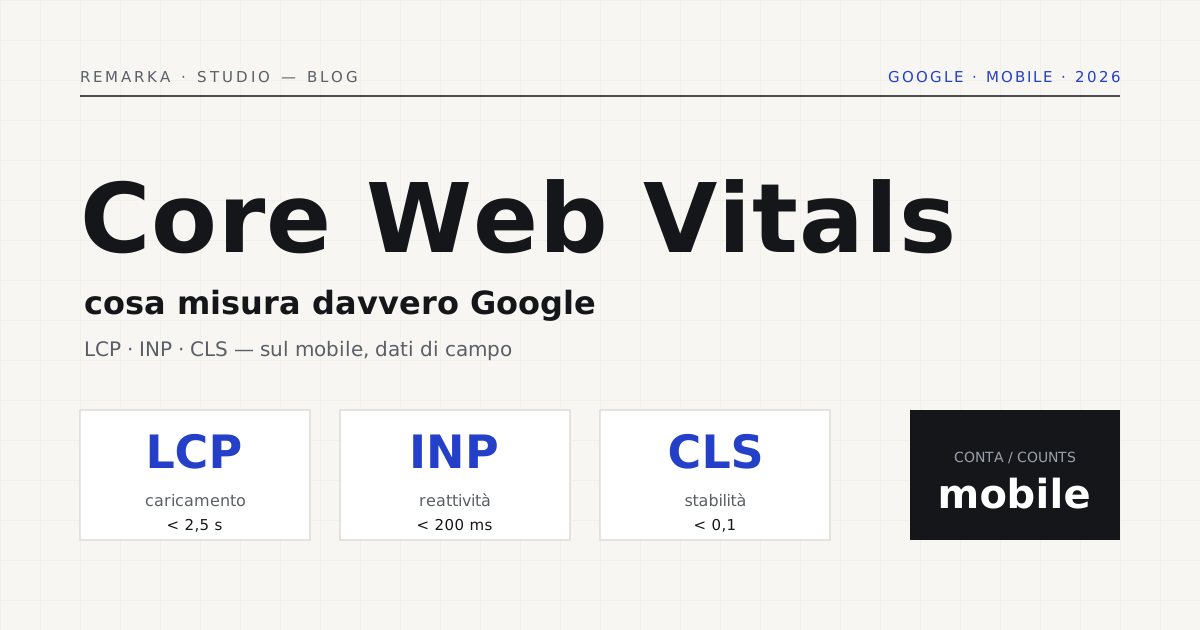
The owner of a garage opens the site from his phone, on his lunch break, on mobile data: he counts the seconds, huffs, closes it. It wasn’t a real customer, it was him — but the gesture is identical to that of someone who was genuinely looking for you and left. LCP, INP, and CLS are the three acronyms Google uses to measure exactly that moment, and with which it decides who to show first in mobile search. We explain them without jargon, with examples from shops and garages rather than startups, and we tell you why the desktop score — which many agencies still insist on — counts for almost nothing anymore.
LCP, INP, and CLS: the three acronyms, translated.
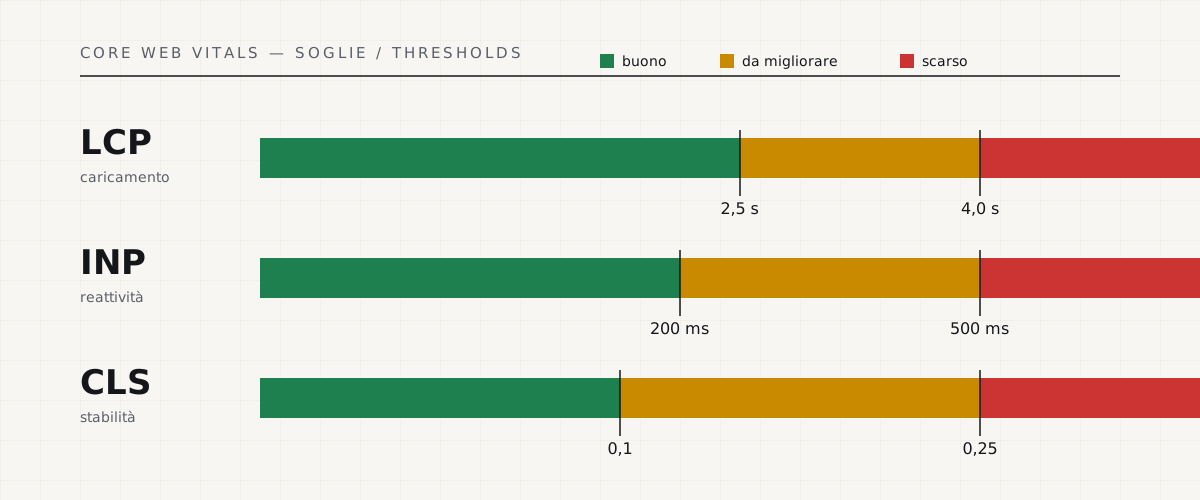
LCP (Largest Contentful Paint) measures how long it takes for the largest content on the page to appear — usually the opening photo or the headline. It’s the question “how long do I have to wait to see something useful?”. Under 2.5 seconds is considered good; over 4, most people have already decided whether to stay. For a furniture shop, the LCP is the first photo of the sofa; for a garage, the phone number at the top.
INP (Interaction to Next Paint) measures responsiveness: I tap a button, how long does the site take to respond? Since 2024 it has replaced the old FID as the official metric, and it’s the most underrated one. CLS (Cumulative Layout Shift) instead measures stability: how many times, while the page loads, the elements “jump” and make you click the wrong thing. Anyone who has tried to press “Add to cart” and bought a different product because the page shifted knows exactly what we mean.
Why the mobile score is the only one that counts.
Many agencies still proudly show the desktop score: 98, bright green, congratulations. Too bad Google has been indexing and ranking sites in their mobile version for years, and your customers look for you from their phones, often on a slow connection with ten tabs open. The score that counts is the mobile one, measured in those conditions — not the desktop one taken in the office on fiber.
That’s why in our contracts there’s a single, clear threshold: PageSpeed 90+ on mobile, guaranteed in writing. Not “we’ll do our best”: a number, verifiable by anyone with the same public tool from Google.
A mistake we often see: the “light” site that becomes heavy after launch, because over time a slider, a chat widget, three tracking pixels, and one more font get added. Each seems harmless; together they sink the INP and LCP. Speed isn’t a finish line you cross once: it’s maintenance. That’s why we re-measure it, we don’t take it for granted.
Lab data or real data: the difference that changes everything.
There’s a misunderstanding that ruins half the discussions about Core Web Vitals. There are two kinds of measurement: lab data (Lighthouse simulates a load under controlled conditions) and field data (the Chrome UX Report gathers the real times of real users, with their phones and their networks). To rank you, Google looks at field data. A site can score 95 in the lab and struggle in the field, because your customers don’t all have the newest iPhone and fiber.
What to do today, in half an hour.
You don’t need a project to start understanding where you stand. Paste the address into our speed test and read the three values: if the LCP is high, the culprit is almost always heavy images or slow hosting; if the CLS is off, the fixed dimensions on images and banners are missing; if the INP is high, there’s too much third-party code blocking the phone. From there you know whether a day of optimization is enough or whether it’s better to rebuild the foundation — and in both cases you start from a number, not a feeling.
Measure your site’s Core Web Vitals now — for free →
Slow site? The 7 real causes and what it costs to fix them →
Sources.
The figures and claims in this article come from here. These are primary sources, not summaries: open them and check for yourself.
- web.dev — Web VitalsThe Google page that introduces and defines the Core Web Vitals.
- web.dev — Largest Contentful Paint (LCP)The loading metric: good threshold under 2.5 seconds.
- web.dev — Interaction to Next Paint (INP)The responsiveness metric that replaced the old FID in 2024.
- web.dev — Cumulative Layout Shift (CLS)The visual stability metric: good threshold under 0.1.
- Chrome UX Report (CrUX)The field data on real users, the ones Google actually uses to rank you.
Let’s talk about your website.
Free analysis of your current website; a fixed quote within 24 hours of the call.